
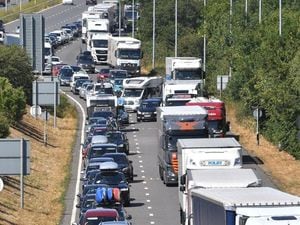
Drivers waste one minute for every three miles in Shropshire
Drivers are held up a minute for every three miles they cover in Shropshire – but they are still some of the shortest delays in England.
As figures are released showing the length of delays across the country, the Local Government Association has called for more funding and greater powers to reduce road congestion.
For Telford drivers are held up for a minute every four miles in the town.
The statistics show that cars and vans were delayed by an average of 20.2 seconds every mile along Shropshire’s A-roads last year, according to data from the Department for Transport.
It meant that each driver wasted 11.1 per cent less time than during the previous year.
Yet it was still one of the greatest decreases in the country, where the average was 0.8 per cent.
In Telford, cars and vans were delayed by an average of 17.7 seconds every mile along the borough’s A-roads last year – meaning each driver wasted 2.6 per cent less time than during the previous year.
That was a shorter hold-up than the national average, 47.3 seconds per mile.
Martin Tett, LGA transport spokesman, said there had been “underinvestment” in local roads.
He added: “It would already take £9.8 billion and over 10 years for councils to clear the current local road repairs backlog.
“Councils also need extra funding to plug the £650 million gap in concessionary fares payments councils get from the Government.
“Having to fill this gap means less support for bus services which relieve congestion.”
Challenge
Local authorities should have powers to challenge moving traffic violations, he added.
Between 2015 and 2018, the waiting time faced by each driver in Shropshire rose from 19.9 to 20.2 seconds for every mile travelled.
That’s an increase of 1.5 per cent, compared to 8.8 per cent in the West Midlands and 6.1 per cent nationwide. In Telford between 2015 and 2018, the waiting time faced by each driver in Telford and Wrekin rose from 15.7 to 17.7 seconds for every mile travelled.
That equates to an increase of 12.7 per cent.
Across England, drivers lingered the longest in the City of London, where the average hold-up last year was nearly five minutes for every mile.
Rutland, in the East Midlands, had the shortest waiting time, at only 12.4 seconds per mile.
According to the figures, the worst time to hit the road across England is on weekdays between 4pm and 7pm.
Over the 12 months ending March 2019, the period with the latest statistics available, the average speed for vehicles travelling during the end-of-workday rush was 22.2 miles per hour.
This was slower than the busy morning commute – 23.6mph – and the middle of the day lull between peak times.
A spokeswoman for the Department for Transport said the Government is spending more than £50bn to reduce congestion.
She added: “We also recognise the valuable role played by other modes of transport in reducing congestion – modernising our railways through a record £48 billion investment, tripling cycling and walking investment per head since 2010, and investing £2.5 billion through the Transforming Cities Fund to develop innovative public transport schemes in some of England’s biggest cities.”